Showing posts with label matlab plots. Show all posts

Tuesday, April 17, 2012

Linked Plots

The following video shows how data can be linked to plots, so that if you change the data (variable in workspace), the plot will be updated automatically.

See the video tutorial here:
http://www.mathworks.de/videos/matlab/linked-plots-and-data-brushing.html

Tuesday, January 17, 2012

Change Label of a Colorbar in Matlab

Hi there,

Everytime I need this code, I don't know where to look for it. I hope google will find it from my page, and help other users.

The problem is: You need to label the colorbar in a plot, and you don't know how.

Solution:

set(get(h.colorbar,'YLabel'),'String','myLabel')


Leave your comments if you have a better idea.

Thanks

Wednesday, January 28, 2009

placing text on figures

This posting is very cool. i have been looking for something linke this the other day...

take a look at the posting here.

Thursday, December 4, 2008

breakplot

Wow!!!

The breakplot funktion as explained in this blog, can be used to break a plot in two, if your data has different ranges... take a look at the blog posting for more information and pictures.

Friday, September 5, 2008

Cool smooth plots with matlab

i have these pictures from Duog's blog:


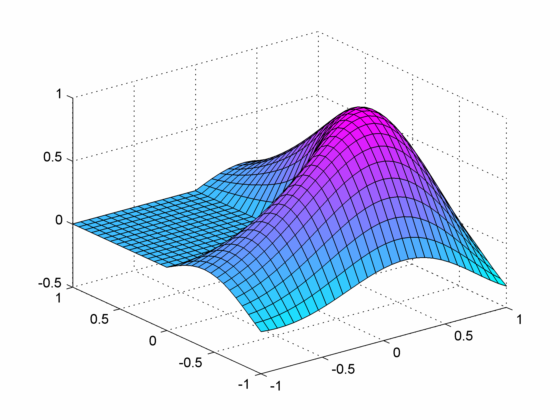
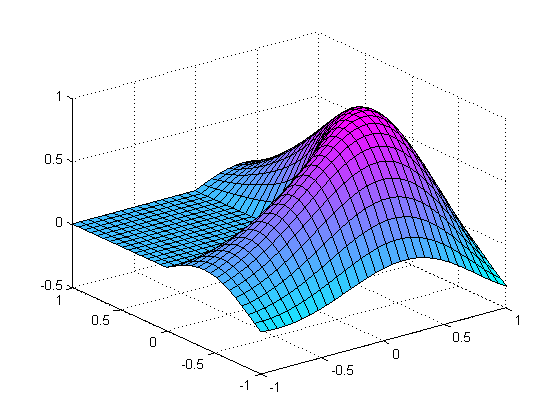
Not smooth:Smooth:
More Information at Duog's blog

Friday, August 1, 2008

batch proces picture files in matlab

I have discovered a very good posting in a mathworks blog.

Here you'll find information about the question "How do I process a set of image files in a directory?"

Have a while

Wednesday, July 30, 2008

advanced way to export figures using hgexport with matlab

i will explain how to export figures to a file using hgexport with matlab.
here is how:
first you need to create the figure:


h.figure = figure
clf
position = get(gcf,'Position');
set(h.figure,'Color','w',...
'PaperPositionMode', 'auto', ...
'Units','in','Position',[position(1:2) 6 2.5 ],...
'PaperPosition',[0.25 0.25 6 2.5])

then, plot the figure. use all the commands you like, like plot, stairs and subplot...
at the end, export the figure using hgexport:

myStyle = hgexport('factorystyle');
myStyle.Format = 'png';
myStyle.Width = 6;
myStyle.Height = 2.5;
myStyle.Resolution = 300;
myStyle.Units = 'inch';
myStyle.FixedFontSize = 12;
hgexport(h.figure,'fileout.png',myStyle,'Format','png')

with Width and Height you can control the size of the file in inch (units).

Tuesday, July 22, 2008

about renderers and exporting figures

Today i was having trouble exporting a figure using the opengl renderer (default for surfaces). To see which renderer a figure is using, use this command:

get(gcf,'Renderer')

The solution was to change the renderer to z-buffer. To do so, just use this command:
set(gcf,'Renderer','zbuffer')

This was necessary to export my carpetplots using the command:

myStyle = hgexport('factorystyle');
myStyle.Format = 'png';
myStyle.Width = 6;
myStyle.Height = 4;
myStyle.Resolution = 300;
myStyle.Units = 'inch';
myStyle.FixedFontSize = 12;
hgexport(h.fig,'filename.png',myStyle,'Format','png')

See my other posts to know more about the carpetplot function.

Thursday, July 17, 2008

Saving figures from the command line in Matlab

In the documentation of the function saveas you can read, that there is an alternative using the gui: file -> save as....

for me, this 2 methods did a different grafic, because of the different resolution used to export the figure.

There is an article in the mathworks technical solutions that handles this, but i was unable to create a grafic and save a file that looks exaclty as the plotted figure.

Monday, June 30, 2008

Some cool matlab plots

wow, today i took a look at flickr while i was searching for cool matlab plots.
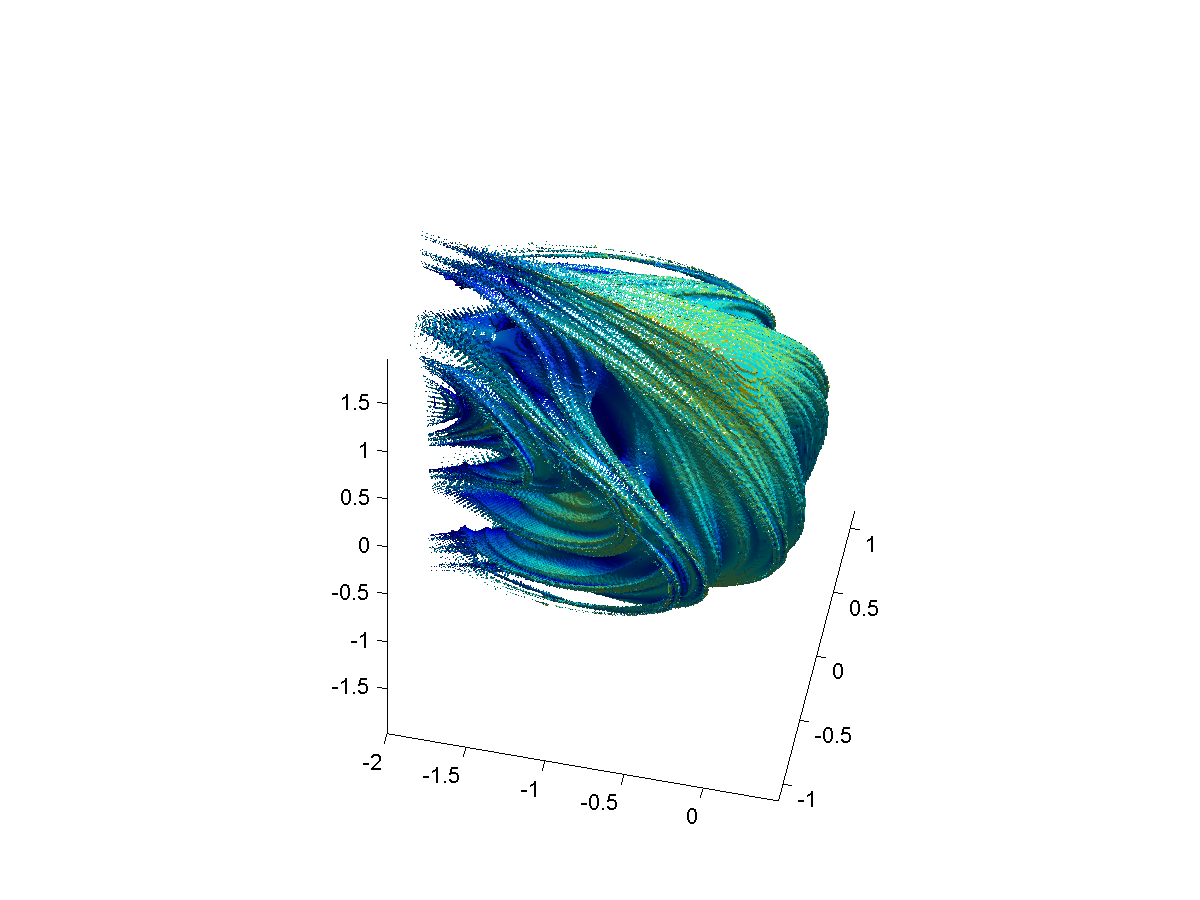
Just take a look at this:You can find more in Arenamontanu's matlab pictures at flickr

Friday, June 20, 2008

How to change the color of the grid without changing the color of the ticks

Have you ever tried to change the color of the grid in a plot? right, the color of the axis changes as well. it is not possible to set the color of the grid separately. There is a good workaround here.
ezplot('x')
grid on
set(gca,'Xcolor',[0.85 0.85 0.85])
c_axes = copyobj(gca,gcf);
set(c_axes, 'color', 'none', 'xcolor', 'k', 'xgrid', 'off', 'ycolor','k', 'ygrid','off');


this will generate gray grids, like in the picture above.


Wednesday, June 18, 2008

SETAXES: A matlab function to change axes parameters. Best to add latex commands to the ticks in Matlab

Thie file SETAXES (by Mukhtar Ullah)is prety cool. It allows you to introduce LaTeX commands into the ticks of a plot, very important if you plan to make good-looking plots.

matlab advanced plots

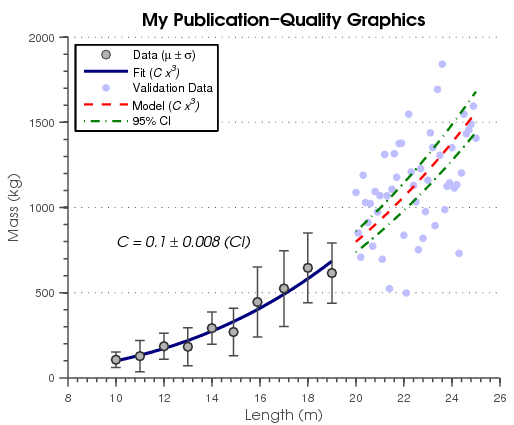
in this post you can find information über advanced plots with matlab. here is a preview of the plots:

Tuesday, March 11, 2008

the difference between 'annotation' and 'line'

do you ever tried to make annotations for a plot within a script? if you just draw a line using the gui and then take a look at the generated m-code (generate m-code), you'll find the code generator uses the function annotation. for me, this is not the best choice.
annotation uses a special layer (Annotation Layer). The coordinates are from 0 to 1 for x and y and covers the whole area of the figure.

Using the command 'line' (if you are trying to draw a line. there are others like text, and rectangle) it is posible to draw a line within the plot area, using x and y as data coordinates.

bye

Thursday, March 6, 2008

advanced subplots in matlab

Hi People, there is a new interesting video blog etnry at matlab. It talks about advanced technics to make subplots.

you can find the video here:

Thursday, November 22, 2007

carpetplot with matlab - part 2

hi, i have made some modifications to the carpetplot function.

here they are


function carpetplot(data,FigNr)

max_zeilen = 24;
zeile=1;
spalte=1;
i=1;
while spalte <= 365, while zeile <= max_zeilen, DATA(zeile,spalte)=data(i); zeile=zeile+1; i=i+1; end spalte=spalte+1; zeile=1; end %DATA=flipud(DATA); x=[1:1:365]; y=[0:1:23]; %% figure(FigNr) clf axes1 = axes(... 'FontSize',12,... 'LineWidth',1,... 'Box','on',... 'Parent',figure(FigNr),... 'YDir','reverse',... 'YTick',[0 4 8 12 16 20 ],... 'PlotBoxAspectRatio',[1 1 1]); xlabel(axes1,'Tage im Jahr'); ylabel(axes1,'Uhrzeit'); grid(axes1,'off'); hold(axes1,'all'); set(gca,'XLim',([1 365]),'YLim',([0 23]))%,'ZLim',([-20000 -5000])) surf(x,y,DATA,'EdgeColor','none',... 'LineWidth',1,'Parent',axes1); view(0,90) colorbar('Fontsize',12) annotation(gcf,'textarrow',[0.9 0.9],[0.7723 0.8215],... 'TextEdgeColor','none',... 'TextRotation',90,... 'FontSize',12,... 'String','Tempeartur in °C',... 'HeadStyle','none',... 'LineStyle','none');

Friday, November 9, 2007

carpet plots with matlab


if you are planning to plot some data as carpet plot, you can use matlab. there is a simple trick to do that.

in this example, i create a carpet plot for a 35040 vector.
first, i convert the data into a 365x96 matrix. then i plot it using the surf command, and change the view point with "view(0,90)"
that's all!
here the function:


function carpetplot(data,FigNr,colormap)


max_zeilen = 24*4;
zeile=1;
spalte=1;
i=1;
while spalte <= 365,
while zeile <= max_zeilen,
DATA(zeile,spalte)=data(i);
zeile=zeile+1;
i=i+1;
end
spalte=spalte+1;
zeile=1;
end


x=[1:1:365];
y=[0:(1/(4)):24-1/(4)];
figure(FigNr)
clf
axes1 = axes(...
'FontSize',16,...
'LineWidth',1,...
'Box','on',...
'Parent',figure(FigNr));%,...
% 'CLim',[-20000 -5000]);
xlabel(axes1,'Tag im Jahr');
ylabel(axes1,'Uhrzeit');
grid(axes1,'off');
hold(axes1,'all');


set(gca,'XLim',([1 365]),'YLim',([0 (24-1/(4*60))]))%,'ZLim',([-20000 -5000]))

surf(x,y,DATA,'EdgeColor','none',...
'LineWidth',1,'Parent',axes1);
view(0,90)


colorbar1 = colorbar('peer',...
axes1,'EastOutside',...
'Box','on',...
'FontSize',16,...
'XLim',[-0.5 1.5], 'YLim', [-20000 -5000],...
'CLim',[0 6]);


%load('MyColormaps','mycmap')
set(figure(FigNr),'Colormap',colormap)

% set(axes1,'CLim', [0 4])
take a look to the part 2 of the carpet plot function