In this posting, seth explains how does the Simulink modell advisor function. You can
find the function under Tools -> Model Advisor: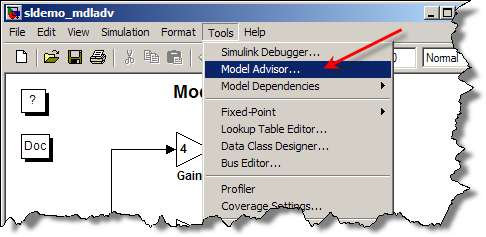
Thursday, December 4, 2008
Increase speed and debug Simulink modells
Friday, September 5, 2008
Cool smooth plots with matlab
i have these pictures from Duog's blog:
Not smooth: Smooth:
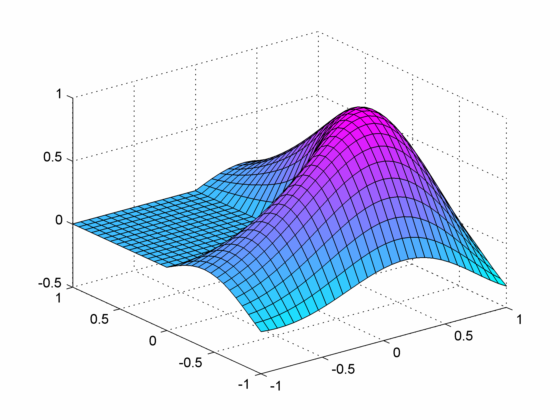 More Information at Duog's blog
Jiro’s live seminar. Complete Video for download
Jiro made a good video seminar on matlab. You can download a high res. video here:
http://www.mathworks.com/matlabcentral/fileexchange/loadFile.do?objectId=21029&objectType=FILE
Friday, August 1, 2008
batch proces picture files in matlab
I have discovered a very good posting in a mathworks blog.
Here you'll find information about the question "How do I process a set of image files in a directory?"
Have a while
Wednesday, July 30, 2008
advanced way to export figures using hgexport with matlab
i will explain how to export figures to a file using hgexport with matlab.
here is how:
first you need to create the figure:
h.figure = figure
clf
position = get(gcf,'Position');
set(h.figure,'Color','w',...
'PaperPositionMode', 'auto', ...
'Units','in','Position',[position(1:2) 6 2.5 ],...
'PaperPosition',[0.25 0.25 6 2.5])
then, plot the figure. use all the commands you like, like plot, stairs and subplot...
at the end, export the figure using hgexport:
myStyle = hgexport('factorystyle');
myStyle.Format = 'png';
myStyle.Width = 6;
myStyle.Height = 2.5;
myStyle.Resolution = 300;
myStyle.Units = 'inch';
myStyle.FixedFontSize = 12;
hgexport(h.figure,'fileout.png',myStyle,'Format','png')
with Width and Height you can control the size of the file in inch (units).
Tuesday, July 22, 2008
about renderers and exporting figures
Today i was having trouble exporting a figure using the opengl renderer (default for surfaces). To see which renderer a figure is using, use this command:
get(gcf,'Renderer')
The solution was to change the renderer to z-buffer. To do so, just use this command:
set(gcf,'Renderer','zbuffer')
This was necessary to export my carpetplots using the command:
myStyle = hgexport('factorystyle');
myStyle.Format = 'png';
myStyle.Width = 6;
myStyle.Height = 4;
myStyle.Resolution = 300;
myStyle.Units = 'inch';
myStyle.FixedFontSize = 12;
hgexport(h.fig,'filename.png',myStyle,'Format','png')
See my other posts to know more about the carpetplot function.
Monday, July 21, 2008
Libraries in Simulink -
It is very important to use libraries in simulink if you have peaces of code (or subsystems) that repeats over a modell or even more. Take a look at this posting from Seth, and learn how to create and use libraries in simulink.
Thursday, July 17, 2008
Saving figures from the command line in Matlab
In the documentation of the function saveas you can read, that there is an alternative using the gui: file -> save as....
for me, this 2 methods did a different grafic, because of the different resolution used to export the figure.
There is an article in the mathworks technical solutions that handles this, but i was unable to create a grafic and save a file that looks exaclty as the plotted figure.
Friday, July 11, 2008
Save Time writing M-Functions in Matlab
If you usually write m-Functions, you can consider using Templates to save time. In this blog you can find a small tutorial on how to use templates.
The time you need to write a new function, you just open a "new function M-File" (see picture above).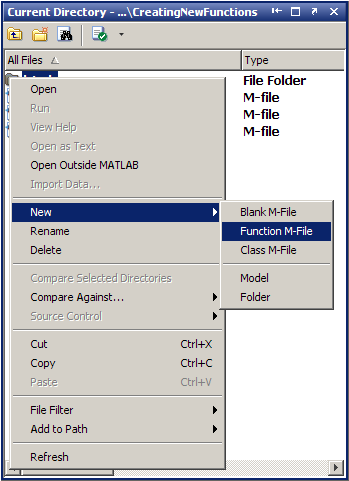
Tuesday, July 8, 2008
matlab and memory
here is some interesting information about matlab and memory allocation. if you get the error "out of memory", you should read this article.
Friday, July 4, 2008
About Algebraic Loops
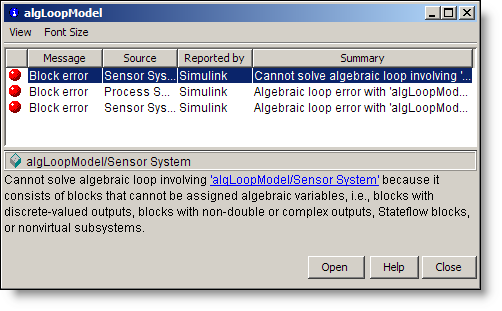
There is a new posting from Seth about algebraic loops in simulink which ich found very interesting. have a look at the original posting here.
Monday, June 30, 2008
Some cool matlab plots
wow, today i took a look at flickr while i was searching for cool matlab plots.
Just take a look at this: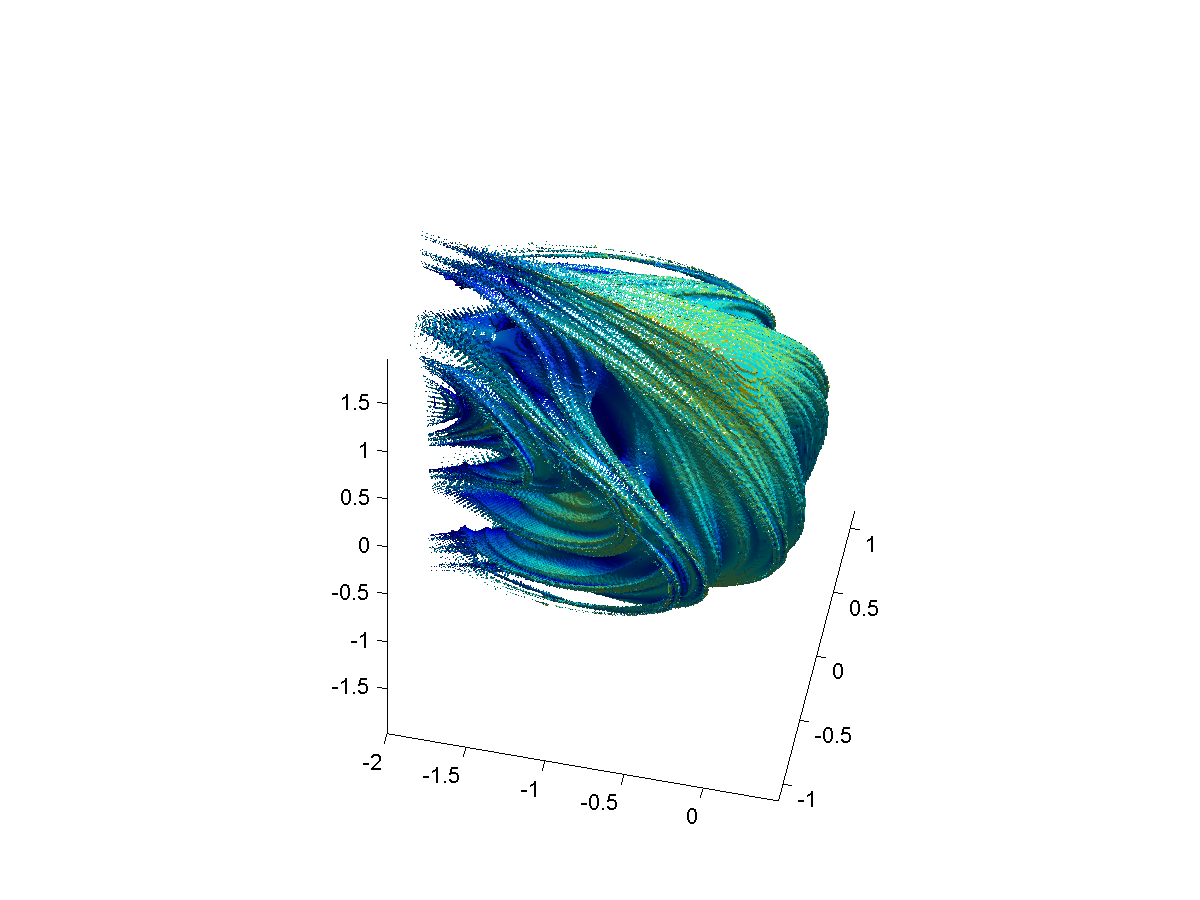 You can find more in Arenamontanu's matlab pictures at flickr
Thursday, June 26, 2008
tips how to use simulink better - Part 2
some days ago i posted about how to use simulink better. Now there is more information from Set. You can find the new posting on how to use simulink better and faster here.
Here are some of the pictures of the original post:
Friday, June 20, 2008
How to change the default Google Desktop Data index folder
here is more information about how to change the index location of Google Desktop Search (gds).
How to change the color of the grid without changing the color of the ticks
Have you ever tried to change the color of the grid in a plot? right, the color of the axis changes as well. it is not possible to set the color of the grid separately. There is a good workaround here.ezplot('x')
grid on
set(gca,'Xcolor',[0.85 0.85 0.85])c_axes = copyobj(gca,gcf);
set(c_axes, 'color', 'none', 'xcolor', 'k', 'xgrid', 'off', 'ycolor','k', 'ygrid','off');
this will generate gray grids, like in the picture above.

Reading Formatted Text in Matlab
Have you ever tried to read formatted text in matlab without effort? i do, bot now, there is a blog posting that handles this issue. Try it out right here.
Have a while!
Wednesday, June 18, 2008
advanced use of reshape
on this posting i explained how to use reshape. Now i want to share with you a good idea i had today.
The idea is to use reshape to acces some part of a vector. Lets say, A is a vector with 35040 entries (365 days, 24 hours, 4 values per hour... 4 values per hour one year long). If you want to make a sum of A for every day, you can do that with a for-loop. this isn't very fast. Instead of that, you can use reshape:
B=reshape(A,24*4,[]);
B is a 96 (one day) x 365 Matrix. Then, you can just make sum(B) and you have the sum of all days into a vector without using any loop!
SETAXES: A matlab function to change axes parameters. Best to add latex commands to the ticks in Matlab
Thie file SETAXES (by Mukhtar Ullah)is prety cool. It allows you to introduce LaTeX commands into the ticks of a plot, very important if you plan to make good-looking plots.
matlab advanced plots
in this post you can find information über advanced plots with matlab. here is a preview of the plots:
Latex Symbols (for matlab)
Here is the complete list of Latex Symbols. You can use this symbols in matlab as well.
Monday, June 16, 2008
Firefox 3.0 Download Day
The firefox download day beginns today, 17. Jun 2008 at 1900 CET. you can contribute downloading firefox 3 until tomorrow at 1859 CET!!!!
have a while!
Thursday, June 12, 2008
reshape - How to reshape a Matrix or a Vector in Matlab
The following code transforms a Matrix A
A =
1 2 3 4 5
6 7 8 9 10
11 12 13 14 15
16 17 18 19 20
into a vector, in the order shown in A.
reshape(flipud(rot90(A)),[],1)
Wednesday, June 11, 2008
convert a vector into a matrix in matlab
i was searching for the way to convert a vector into a matrix with matlab and i found (good) ways to do it.
the first one is using reshape (link with examples), the second is using vec2mat (link with examples).
Sunday, June 8, 2008
Tips on how to use Simulink better
Great tips on how to configure and use simulink. visit the link here.
i liked them. you too?
Friday, May 30, 2008
Firefox 3.0 Download Day
If you like firefox, you can contribure with this crazy idea.
http://www.spreadfirefox.com/en-US/worldrecord
Wednesday, May 28, 2008
source control interface
in this link you'll find the matlab documentation for source control interface. In the next days i'll try to get subversion support for matlab working... any comments?
capture mouse movement in matlab
have you ever tryied to capture the mouse movement through callbacks in matlab? Here you'll find how.
Tuesday, May 27, 2008
Werkzeug zum Erstellen von Programmablaufplänen für Windows
PapDesigner ist ein cooles und leichtes Werkzeug zum Erstellen von Programmablaufplänen (PAP) angelehnt and die DIN 66001. Ich benutze es, um Matlab Algorithmen zu entwickeln.
Monday, May 19, 2008
Friday, May 16, 2008
Question as GUI in Matlab
if you want to ask the user something in matlab using a GUI, you can use the command
questdlg
very cool. check this blog or the matlab help for more info.
Thursday, May 15, 2008
find a string in a cell array
Friday, May 9, 2008
matlab and path
the function path in matlab can be used to add a directory to the path. this works only for the actual session of matlab. if you close matlab, the path is reseted to the original values.
Tuesday, April 29, 2008
Using dbstop if error
Hi,
Today, Doug posts a very interesting way to debug functions in matlab.
It works with this command:
dbstop if error
More Info here.
Monday, April 28, 2008
Files under Folders
this might be intersting...
http://blogs.mathworks.com/pick/2008/04/25/files-under-folders-fuf/
Wednesday, April 23, 2008
convert a cell array into a vector with strings
if you have a cell array into a vector with strings, you can use the following command:
my_cell = {'a','b'};
my_new_vector = [my_cell{1:end}];
my_new_vector = [my_cell{1:end}];
Friday, April 18, 2008
Excel step graphics
Today i discovered in google a great way to create step plots in excel. You can find the (short) tutorial here:
http://www.tushar-mehta.com/excel/charts/step_chart/
Tuesday, April 8, 2008
print in matlab to the prompt
Hi, i was searching for a possibility to print something in the prompt from a script without using the function disp. disp allways make a new line, and i wanted to have something printed in a single line. fprintf does it very well. check this example:
for i=1:1:5; fprintf('.'); pause(2);end; fprintf('OK'); disp(' ')
Friday, April 4, 2008
Advanced Maneuvers using Mux and Demux | Seth on Simulink
Hi, here is some information about Bus signals in matlab.
have a while
Wednesday, March 19, 2008
free matlab webinar: application deployment with matlab
there is an upcoming webinar (20.03.2008) called Application Deployment with MATLAB on the way. you can find it here.
how to add my own library on simulink to the library browser in r2008a
Hi,
In this blog you'll find how to add your own library in simulink to the library browser in r2008a.
have a while.
Wednesday, March 12, 2008
some changes for r2008a (simulink)
today, i discovered a post dedicated to some new cool features of simulink in the actuall release 2008a. check this out!
http://blogs.mathworks.com/seth/2008/03/11/springtime-and-r2008a/
have a while
Tuesday, March 11, 2008
the difference between 'annotation' and 'line'
do you ever tried to make annotations for a plot within a script? if you just draw a line using the gui and then take a look at the generated m-code (generate m-code), you'll find the code generator uses the function annotation. for me, this is not the best choice.
annotation uses a special layer (Annotation Layer). The coordinates are from 0 to 1 for x and y and covers the whole area of the figure.
Using the command 'line' (if you are trying to draw a line. there are others like text, and rectangle) it is posible to draw a line within the plot area, using x and y as data coordinates.
bye
X Steam, Thermodynamic properties of water and steam
Hi people, as i posted before, XSteam is a package of choice for calculating the thermodynamic propoerties of water and stem, such as entropy, enthalpy , etc...
there was a posting in a matlab blog abbout this last week. you can read this posting here.
You can find the files here at the matlab central.
bye
Thursday, March 6, 2008
whats new in matlab/simulink 2008a - a free webinar
Hi,
Today, there are 2 free webinars about matlab and simulink 2008a. you can register here.
advanced subplots in matlab
Hi People, there is a new interesting video blog etnry at matlab. It talks about advanced technics to make subplots.
you can find the video here:
Wednesday, February 27, 2008
open dialog to "open file" in matlab
Hi people, today there is a very interesting post on a matlab central's blog. it describes how you can open a dialog to choose a file from the command line, and use it in some scripts.
the video is here.
enjoy!
Thursday, February 21, 2008
calculate min/max in matlab excluding the zeros
the problem is how to calculate the minimum of a vector excluding the zeros?
here is an example how to do that:
min(myVector(myVector > 0))
about logical indexing
Today, M-Lint was telling me that "logical indexing is usually faster than FIND".
I didn't knew what logical indexing means. a short google search and i found this out:
if you want to perform the following operation:
KdP(find( (dP> 1000) & (dP <= 2000) )) = 2;
you can optimize it just by omitting the find command just like this:
KdP( (dP> 1000) & (dP <= 2000) ) = 2;
. Matlab is just capable to handle the "logical indexing" which means the indexes of the vector that match the conditions.
Tuesday, February 19, 2008
how to turn a matrix into a single vector with matlab
hi, if you are trying to transform a matrix into a single vector you sould't use if's.
there is a very easy way to do that.
if your matrix a = [1 2 3; 4 5 6], the command b=a(:) will generate a matrix b that looks like this: [1 4 2 5 3 6]'
Tuesday, February 12, 2008
use profiler to improve code
there is a very cool application in matlab to help you improve the code. it is called "profiler".
let me give you an example. If you have a script named "name_of_script.m", you can enter the following commands to check it:
profile on, name_of_script, profreport('name_of_script')
at the end, you'll get a new windows, where you can find which section of the script is the bottleneck.
happy coding!
improving matlab code to run faster
improve matlab code to run faster... that's the question. i found a very cool document on the web. you can find it here.
Saturday, February 9, 2008
function in matlab to convert 1/4-h vectors to 1-h vector
sometime i have to handle with large data vectors, which are time measurements. One value each 15 Min.
For the analysis, i can use 1 value per hour. to convert the vectors i use the following function:
function DATout = convert_15min_1h(DATin)
size_15min=length(DATin);
size_1h=size_15min/4;
DATout=zeros(size_1h,1);
for i=1:1:size_1h
von=(i-1)*4+1;
bis=(i)*4;
DATout(i)=sum(DATin(von:bis))/4;
end
Friday, February 8, 2008
Zeilenabstand in LaTeX
um in LaTeX den Zeilenabstand zu ändern, z.b. von 1,5 auf 1,0 oder sogar 1,25, benutzt man diesen Kommando im prämble:
\renewcommand{\baselinestretch}{1.0}
Tuesday, January 29, 2008
count how many Inf's are in a vector
the following command returns how many Inf's are in a vector
length(find(myVector==Inf))
Tuesday, January 8, 2008
Delete sheets without confirmation prompts using VBA in Excel
Hi people,
i was searching for a way to delete a worksheet without confirmation prompt in vba and i found this link.
the code is listed here:
Sub DeleteSheet(strSheetName As String)
' deletes a sheet named strSheetName in the active workbook
Application.DisplayAlerts = False
Sheets(strSheetName).Delete
Application.DisplayAlerts = True
End Sub
Subscribe to:
Comments (Atom)